Energy Estate, with our friends at Cranmore Partners, recently co-published H2i, a ranking of the top 40 countries for hydrogen producers (www.h2-index.com/). By Peter Conway, director, Energy Estate.
One of the criteria used in establishing the index is Renewable Energy Potential, that is, the requisite in-country characteristics for green hydrogen (GH2). This paper considers some of the characteristics for GH2 as well as those for blue hydrogen (BH2), in both instances focusing on the cost-competitive production in the form of the levelised cost of hydrogen (LCOH). It also includes the industrial and infrastructure requirements and how these might impact on site selection and competitiveness for the development of a hydrogen project. The views expressed are the author’s and are shaped by Energy Estate’s advisory work in Europe and across several African countries along with our development experience on projects in Australia, New Zealand and the USA.
Like-for-like comparisons
The cost breakdown for GH2 and BH2 can be broadly summarised as follows in Table 1.
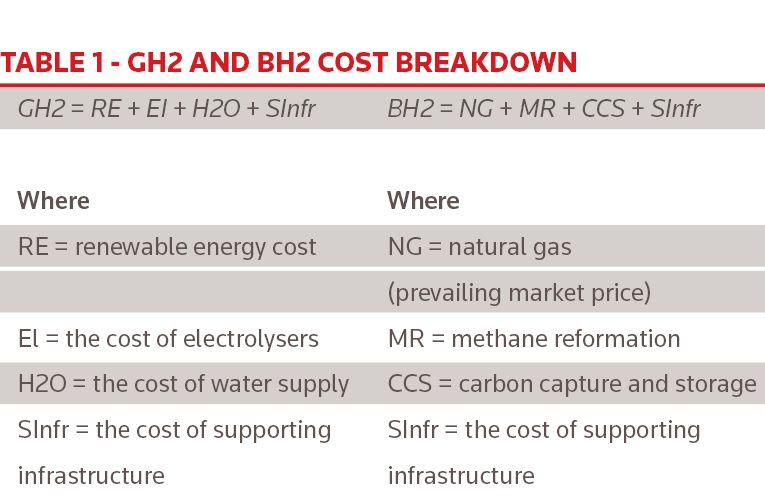
Though as referenced above the focus of this paper is on locational factors, particularly energy input costs and existing infrastructure, the overall cost is also impacted by:
* The cost of electrolysers;
* Carbon price and/or carbon border adjustments (in both instances, if any such exist); and
* Other subsidies including production tax credits in the US and potentially H2 CfDs in Germany, the UK and elsewhere.
Though it is beyond the scope of this article to consider these in detail, nevertheless the following is assumed:
* Electrolysers will witness rapid and sustained cost reductions as production facilities rapidly evolve (see recent announcements from ITM and NEL in this regard), they are scaled up and subject to efficiency improvements reducing energy requirements and increases in lifespan;
* A carbon price of >€50/t for carbon will exist across Europe and the Carbon Border Adjustment mechanism will be introduced by the EU by 2024; and
* Production Tax Credits contained in President Biden’s Build Back Better bill and CfDs in Germany and the UK will be implemented in the coming months.
GH2 and renewable energy
As renewable electricity costs can make up more than 50%, and potentially in excess of 60%, of the cost of hydrogen production, it is essential to minimise the levelised cost of electricity (LCOE). To achieve this requires siting generation capacity in optimal locations, generally being those that have both attractive solar and onshore wind characteristics.
The potential competitiveness of GH2 has been buoyed by the consistent declines in the price of solar and onshore wind costs over the last decade, both on an average benchmark basis as well as through significantly lower project-specific tariffs.
BloombergNEF’s June 2021 LCOE update indicated a 5% fall in the benchmark LCOE for solar to US$48MWh and a 7% fall in onshore wind to US$41MWh, with an expectation of the latter falling below US$30MWh by 2050.
However, on a site-specific basis significantly lower tariffs have been witnessed. The 2GW Al Dhafra project in Abu Dhabi secured a tariff of US$0.0135/kWh (US$13.5/MWh), while the 600MW Al Shuaiba PV project in Saudi Arabia established a record low levelised cost of US$0.0104/kWh (US$10.4/MWh), some 78% below the benchmark.
Similarly, though onshore wind is harder to assess as a greater number of developments are non-bid related, transactions such as the recent 100MW Qorao’zak Phase I wind power plant project in Karakalpakstan Uzbekistan delivered a tariff reported to be US$25.7MWh, some 38% below the benchmark.
Earlier in 2021 Siemens Energy indicated that a pathway for GH2 to be competitive with grey hydrogen required a cost of less than US$1.5/kg by 2025. To achieve this cost for GH2 would, in turn, require a LCOE of less than US$16/MWH and a load factor in excess of 68.5% (6,000 operating hours).
The reference tariff points of well-located projects indicated above suggest that both the LCOE of less than US$16MWh and 68.5% load factor look achievable in this timeframe. Moreover, the recent announcements of hydrogen development in countries such as Mauritania and Namibia, which combine extremely attractive solar and wind characteristics, clearly point in this direction. In addition, in some instances these characteristics are complementary with the best wind conditions arising during the afternoon and into the night, so maintaining the load factor as the solar generation ends.
One other source of renewable power that is often overlooked is hydro. With fully depreciated hydro plants being able to either deliver base load or complementary overnight generation to supplement solar, this should deliver high capacity factors for electrolysis. Those areas with significant hydro capacity may therefore offer attractive opportunities for competitive GH2 production.
H2O and supporting infrastructure
GH2 requires significant volumes of water for electrolysis. Given the beneficial conditions for wind and solar together with the scale of the developments, the provision of water and/or additional infrastructure may not have a material impact on cost, though as noted further below there are obvious benefits where these already exist.
Many H2 projects are likely to focus upon export of hydrogen derivatives such as ammonia or e-fuels and are thus likely to be proximate to the coast. To this end, desalination through reverse osmosis (RO) technology is seen as an obvious solution to water provision, particularly as the scale-up of renewable power can be used as the energy source. In addition, there may be a strong benefit in terms of social licence to including this (potentially through oversizing the project requirements) as a utility to the local community. In regions such as southern Africa this might represent a significant driver for more widespread economic growth and opportunity.
The other key infrastructure is likely to relate to either (i) a port for export; or (ii) again on a more site-specific basis, an existing industrial or petrochemical facility that may be able to offtake the hydrogen. There might also be niche hydrogen users that could be receptive offtakers. We know of one project located close to a small rocket launch facility.
The development of port facilities would clearly be a significant undertaking and material cost factor that may well either be strongly supported by the host government and/or relate only to the very largest GH2 projects, where the site-specific conditions and scale would overcome such a cost burden. Examples of industrial/petrochemical complexes introducing GH2 would include the Sines facility in Portugal or Sasol’s stated intent to substitute black/grey hydrogen with GH2 at its Secunda and Sasolburg facilities.
Site selection for GH2 will therefore, in many instances, represent a trade-off between the cost and benefits of constructing entirely new infrastructure, based upon the low LCOE (from the attractive solar and wind conditions) as against a higher LCOE but utilising existing infrastructure and indeed potentially repurposing existing petrochemical facilities through substituting existing black or grey hydrogen with GH2. The decision will be entirely site-specific and likely the result of rigorous and detailed commercial and financial analysis.
BH2 and repurposing
In stark contrast to GH2, BH2 will almost always utilise existing infrastructure, particularly but not exclusively related to petrochemical assets. The evolution of BH2 is in most instances a means of repurposing certain assets, reducing the carbon footprint of existing facilities and thus in large part delivering a life extension.
As indicated above, the key costs for BH2 are (i) natural gas; (ii) the process of deriving hydrogen through methane reformation; (iii) capturing and permanently storing the CO2; and (iv) any supporting infrastructure.
Natural gas price
Though subject to significant price volatility, nevertheless the variables of the gas market are at least well understood. However as Figure 1, the 10-year monthly Henry Hub gas price, indicates the volatility is severe, ranging from a low of US$2/MMBTU to a high of US$6/MMBTU.
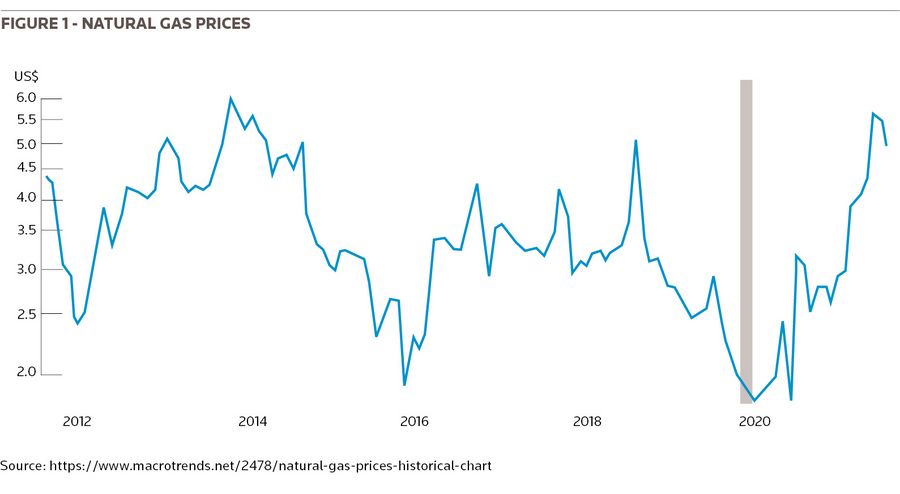
The intrinsic volatility of natural gas will therefore, unless hedged, also deliver intrinsic volatility to BH2, as most costs are an add on to this.
Methane reformation
With reference to methane reformation, this process is well proven and understood. Though there will naturally be variability between facilities, a cost of US$1.25/kg to hydrogen can be assumed based upon a modern and efficient plant.
CCS
The deployment of carbon capture and storage (CCS) is more site-specific and will be impacted by several factors, most notably the scale of the pipeline network connecting users, the distance to the end storage point and the number of users. The approach in the UK has been particularly interesting, with strong government incentives for clusters of industries, promoting both the acceleration of hydrogen deployment within the cluster as well as encouraging multiple-users of CCS so as to reduce both the cost burden and the carbon footprint of various industries. This naturally has an influence on sites, as these need to be close to such clusters as well as to a suitable destination point for the carbon storage.
A key concern remains the efficiency of CCS at scale, with developments such as the Chevron-led Gorgon project in Australia consistently failing to meet its carbon reduction targets. However, CCS has been employed widely and more successfully elsewhere, including in Equinor’s Snohvit LNG project, operational since 2008. Moreover, given the breadth of research and the widespread nature of CCS projects under way across Northern Europe and involving many major oil and gas companies, it seems likely that the technology will rapidly evolve and rates of CO2 capture significantly increase.
One factor for consideration is the extent to which regulatory requirements for BH2 include a minimum threshold of carbon reduction. Further, assuming this is met, carbon pricing may also incentivise high carbon capture rates. With some variance in the effectiveness of CCUS and an estimated 7kg–8kg of CO2 for every 1kg of H2 from reformation of gas, and a carbon price of €50/t (€0.05/Kg), the impact of a 50% capture rate would be €0.175–€0.20/Kg, which is not immaterial. This impact would also be felt by importers assuming the introduction of the EU Carbon Border Adjustment Mechanism.
Supporting Infrastructure
As noted above, there is a strong likelihood of BH2 being produced in areas with existing industrial facilities. To this end, unlike the cost base for GH2, there is unlikely to be a significant need for new infrastructure. There might of course be some site-specific requirements in relation to the repurposing of assets, including pipelines to carry hydrogen and for which the costs will be dependent on length to end-user. Ultimately, however, this is not expected to be material, with the key cost uncertainties of BH2 being the underlying cost of NG + CCUS.
Conclusions
Developers, including incumbent hydrogen producers, are taking materially different approaches to the production of GH2 and BH2, with entities such as CWP focusing on the key characteristics of complementary wind and solar in undeveloped locations such as Mauritania, as opposed to existing large-scale producers such as Sasol, which is not only repurposing its Secunda and Sasolburg facilities through the introduction of green hydrogen, but also analysing the prospect of a greenfield development at Boegoebaai, near the Namibian border, to optimise the wind and solar conditions.
The approach of Energy Estate has been to recognise the trade-offs and focus not only on the LCOH but the all-in cost of the end-product, including transportation. This approach is a strong balance between favourable solar and wind development, potentially complemented by long duration storage, but also looking where possible to repurpose existing facilities. The combination of competitive renewables accompanied by existing infrastructure appears to deliver the optimum economic balance as well as social benefits through industrial repurposing to protect livelihoods.
When considering the development of GH2 or BH2 facilities, site selection is key, whether for renewable power generation focusing on the overall production cost of the final product, or BH2 leveraging off the existing industrial infrastructure. The challenge for developers will be to identify the trade-offs and optimise the benefits of their particular location to deliver competitive low/zero carbon hydrogen and related products.
To see the digital version of this report, please click here
To purchase printed copies or a PDF of this report, please email gloria.balbastro@lseg.com