The solar industry must increase capacity and continue to fight cost escalation to meet climate change goals. By David Dixon, senior renewable analyst, and Sumit Yadav, cost analyst, Rystad Energy.
The last-minute compromises made to the Glasgow Climate Pact – in particular the easing of declared goals pertaining to coal – caused widespread consternation from all corners of the globe, but Rystad Energy’s assessment of the outcome is overwhelmingly positive with regard to prospects for averting critical levels of global warming.
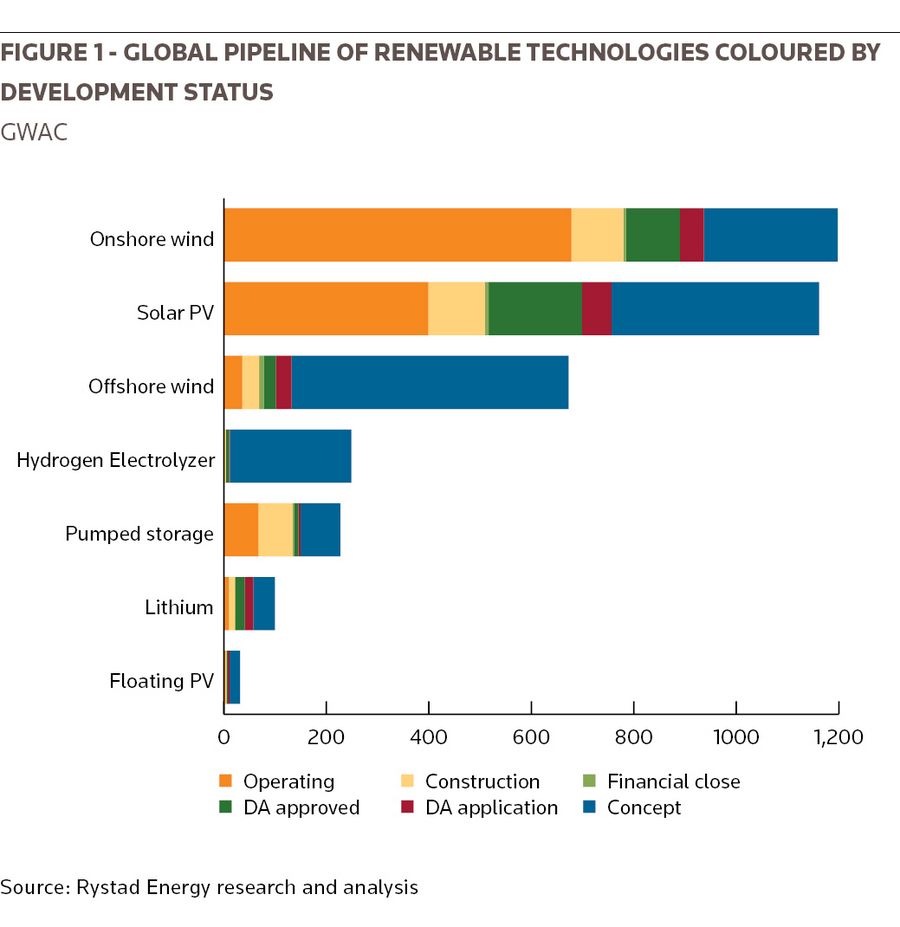
By analysing the results of the COP26 summit using rigorous scenario methodology – combined with our own data-driven forecasts for energy supply – we conclude that a rise of 1.6°C versus pre-industrial levels can be reached if renewable energy sources continue to replace fossil fuel in the energy mix with accelerated growth. More than 100GW of solar power capacity, including residential solar PV, is currently being added annually on a global basis, and this tally is on pace to double every third year to reach 1.2 terrawatts (TW) in the early 2030s, which is the level needed to achieve a 1.6° scenario
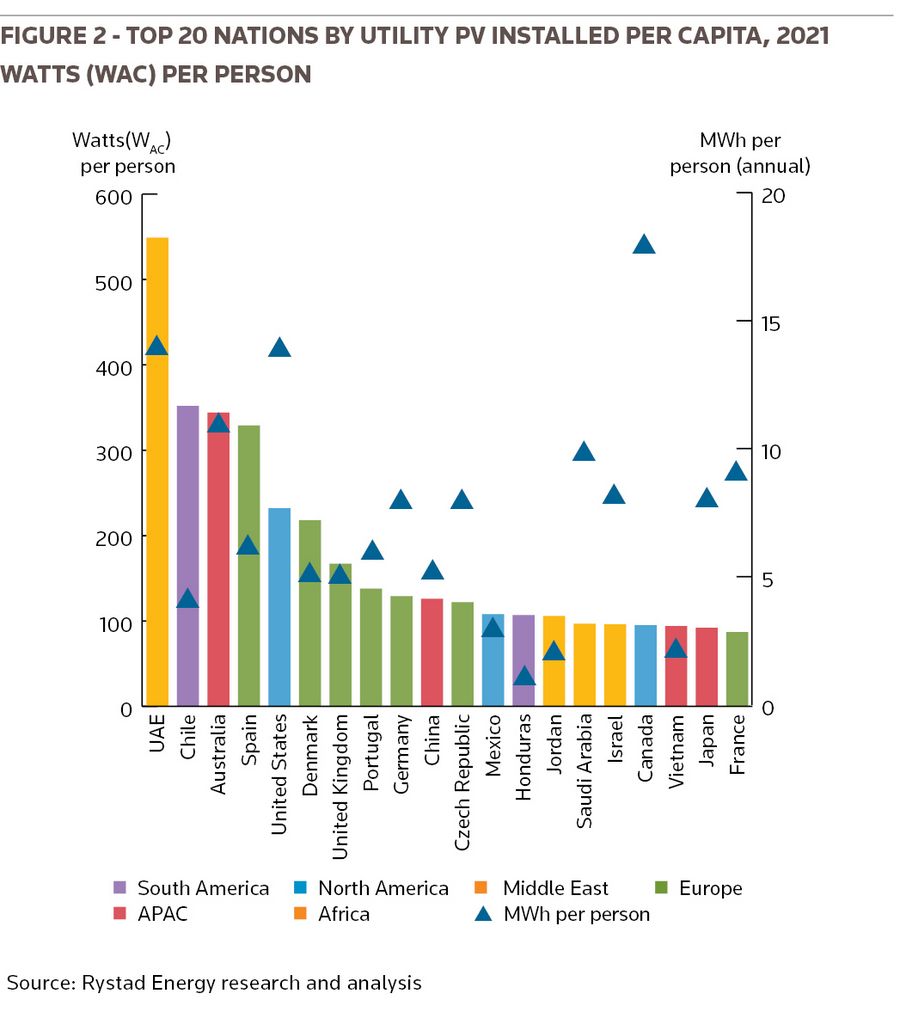
For a handful of countries and companies, the power mix transformation has already begun. The United Arab Emirates (UAE), Chile and Australia lead the world in terms of utility PV capacity installed per capita. The three countries share characteristics that make them quite well suited to PV adoption; they all have ample land for area-intensive PV deployment, good solar irradiance and an abundance of energy-intensive industries thirsty for renewable energy. In Chile, the mining sector is the primary demand segment. In the UAE the oil and gas sector is the primary energy demand segment, while in Australia both mining, and oil and gas have high energy demand.
Spain is the only other nation to have installed more than 300Watts (WAC) per person and has, by far, installed the most solar power per capita in Europe. The United States come in fifth, also with similar characteristics to the top three (space for PV, good solar resource and energy intensive demand segments). We expect utility PV capacity in the US will grow at a rapid pace in the near term. Other regions of growth will include areas with similar characteristics to the top three, such as the Middle East – especially Saudi Arabia – and larger South American nations such as Brazil.
Panel manufacture to 290GW
The aggregated solar panel manufacturing capacity reached 290GW in 2020, which is a 65% increase compared with the previous year. This boost was primarily driven by major solar companies that have significantly expanded production capacity over the past year. In 2018, the total annual solar module manufacturing capacity was 113GW. Longi Green Energy, for example, was able to expand its solar module production capacity from 14GW in 2019 to 50GW in 2020 as it seized all development opportunities while maintaining prudent operations even in a volatile and complicated market environment. The company became the largest player in terms of market share with overall coverage of 17%. Longi Green Energy had annual module production capacity of 8.8GW in 2018.
Module production capacity for Jinko Solar has also been increasing sequentially since 2018. In 2019, the company had a module production capacity of 16GW, which was up by 48% year-on-year. In 2020, Jinko Solar was able to expand its module production capacity further to 31GW – almost double compared with the previous year. This impressive growth was a result of the company’s continuous efforts towards optimising its supply chain management.
The annual solar module capacity of Canadian Solar was 16.1GW in 2020 – 23% growth from 2019 levels and up 81% compared with 2018. The company employed a new vertically integrated flexible business model that combines internal manufacturing capacity with direct material purchases of both wafers and cells. This helped reduce the cost of materials and allowed the company to instantly respond to short-term demand spikes. In addition, Risen Energy’s solar module capacity increased by 27% to 14.1GW in 2020.
JA Solar Technology and Trina Solar, meanwhile, had annual module production capacity of 8.5GW each in 2018, and successfully increased their manufacturing capacity to 11GW and 18.4GW, respectively, in 2019. Due to the introduction of new technologies and a series of new construction and expansion projects, a further boost followed in 2020. JA Solar Technology achieved 23GW annual module production capacity, while Trina Solar hit 22GW.
In terms of market share, Longi Green Energy, Jinko Solar Holding, JA Solar Technology, Trina Solar, and Canadian Solar captured almost 50% of the total solar panel market. First Solar at 6.3GW, GCL at 8GW, Hanwha Q-Cells at 12.4GW and Talesun Solar at 10GW, accounted for the other half.
Global solar module shipments have also been increasing in the past three years. Solar companies recorded total module shipments of 95GW in 2018 and 125GW in 2019. Global shipments then grew to 170GW in 2020 amid increased demand for cleaner and renewable energy sources across the world. Despite Covid-19, Jinko Solar’s annual shipments, for example, increased by 31.4% year-on-year to 18.8GW in 2020, resulting in an overall revenue increase of 18% compared with 2019. The company expects total shipment capacity to be in the range of 25GW–30GW in 2021.
Longi Green Energy’s module shipments increased from almost 11GW in 2019 to 24.5GW in 2020 amid its strategic cooperation agreements with some large energy groups. The company also implemented different marketing strategies across markets and enhanced communication with its customer. This helped it rapidly expand its module products market share and strengthened its supply capacity of raw and auxiliary materials. Longi Green Energy has a module shipment target of 40GW for 2021. Canadian Solar module shipments, meanwhile, increased only moderately in 2019 compared with 2018, reaching 11.3GW in 2020. Most of its sales were to the Americas – a key region for the company – where it saw an 18% year-on-year boost.
Headwinds
However, in recent quarters, supply conditions across the value chain and foreign trade disputes have affected industry-wide demand. There is a huge gap between module shipments and module production capacity, resulting in a lower utilisation percentage As a result of the pandemic and external policies, the entire industry is experiencing shortages in the supply of raw and auxiliary materials, especially polysilicon and glass. Covid-19-related restrictions have not only created shortages in the supply of essential raw materials but have also led to higher prices, resulting in fewer shipments and lower revenues for many industry participants.
The reduced demand for modules in 2020 resulted in lower shipments for GCL Integration Technology, for example. Due to shortage in upstream silicon material and glass supply, the company’s annual shipments fell to 3GW – 38% lower compared with the previous year. Amid Covid-19 restrictions, the prices of core raw materials, solar cells and silicon wafers have increased significantly. Thus, the company’s annual utilisation dropped by 29 percentage points in 2020 to 38%.
A similar trend can be seen in the capacity utilisation of Jinko Solar. The company’s utilisation dropped from 89% in 2019 to 60% in 2020 as a few of its overseas manufacturing units had to limit the number of workers due to pandemic-related restrictions. The company also had to delay some of its shipments as supplies of a few raw materials and logistics were temporarily affected in the first half of 2020.
The aggregated utilisation percentage for solar modules in 2018 was 84%, and it has been decreasing since. The utilisation percentage dropped by 12 percentage points to 71% in 2019, and to 58% in 2020, as logistics’ efficiency and transportation continued to be affected in most parts of the world due to the pandemic. The global spread of Covid-19 has created significant economic disruption in the market and is expected to continue to impact the utilisation rate for most of 2021.
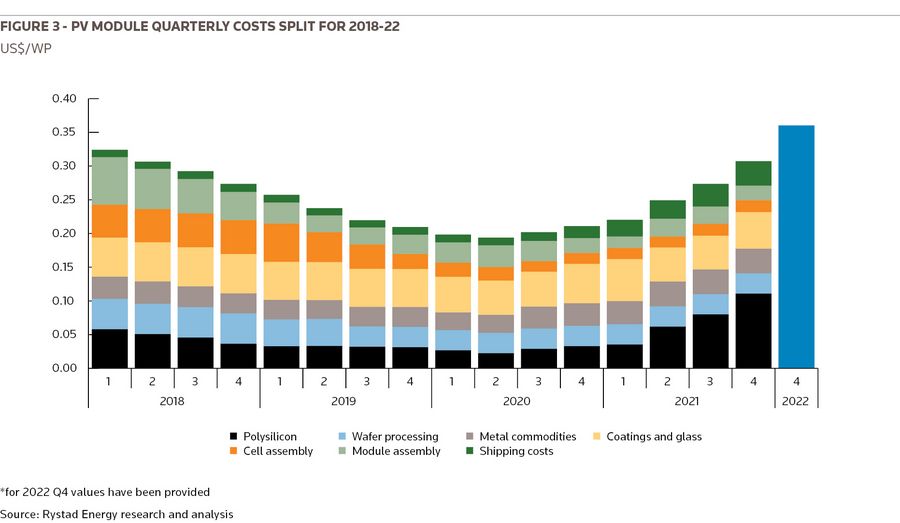
Rystad Energy expects inflationary pressures to continue to hit solar modules into 2022 with forecast prices expected to hit more than US$0.35/Wp. This represents almost a doubling of the 2020 price of modules, the largest single item of a PV project’s capex. The implications are enormous given the PV industry is one that will need to do heavy lifting over the next decade if the world is to decarbonise. However, the short to medium term will witness growing pains due to commodity price inflation and high shipping costs.
In the short term, to end-2022, shipping and polysilicon are expected to have the largest impact on price rises, before prices of both come back to pre pandemic levels, while in the medium term, two to four years, costs associated with copper and silver present a larger risk. Rystad’s expectation of US$0.35/Wp for modules, delivered to utility projects in 2022 is a price not seen for modules since 2016. Historical evidence suggests such a price for modules would result in only 90–100GWdc being deployed globally in 2022, resulting in a rare outcome for PV, a year of negative growth for a technology that has only been growing for the past decade.
Solar PV, has risen as a technology requiring significant subsidies to initiate deployment only six years ago to one of the cheapest sources of electricity in history today. Power purchase agreements in the Middle East and South America are frequently below US$30/MWh and in the Middle East closer to US$10/MWh.
The module supply chain faces headwinds into 2022 as key commodity prices continue to rise putting further upward pressure on module prices. Rystad Energy evaluated several key inputs into module costs, including copper, aluminium, polysilicon silver and glass, as well as shipping, to forecast the potential price outlook to Q4 2022. The forecast scenario assumed continued upward pressure on aluminum, copper, silver, and polysilicon. Polysilicon was forecast to peak in 2022 as new supply enters the market. One of the leading polysilicon producers, Daqo, estimates global polysilicon production capacity being able to supply 240–250GWdc in 2022, significantly exceeding expected demand. For other commodities such as silver, copper and aluminum, Rystad is expecting upward price pressures to continue into 2023. Global silver supply has been in decline since 2015, while its use in PV, 10% of global demand, continues to grow.
A strong spike in aluminium prices driven by supply constraints in China and improved demand from sectors such as construction, transport, and machinery manufacturing will result in aluminium prices to rise by nearly 50% by Q2 2023. While aluminium utilisation per cell is expected to continuously decline over the coming years, owing to sturdy growth in prices, its share in module cost will double by Q2 2023, post which it will start gradually declining.
Like aluminium prices, copper prices will also witness a spike due to power shortages in China, high crude prices, and a growing supply deficit. With leading copper mines now nearing their peak capacity and slow development of new mines, we expect copper prices to more than double by end-2023 compared with present levels. However, its impact on module prices will be minimal compared with aluminium, as copper utilisation in module manufacturing is significantly lower.
Historically, shipping costs have had a minimal impact on module prices, with their total share of module costs being limited to less than 5%, However, since early 2021, driven by high port congestion and resilient crude prices, the share of shipping costs in total module costs has continued to rise and is expected to peak at 12% by the end of Q2 2022. However, post mid-2022 we expect the impact of shipping costs to significantly decline and exhibit minimal volatility from 2023 onwards
At US$0.36/Wp there will be significant headwind to the decade-long growth of solar PV. With hardware making up over 60% of a solar PV projects, capex and modules being the largest individual item has a substantial impact on project economics. Historically module prices between US$0.35/Wp and US$0.40/Wp have resulted in 90 to 100GWdc of annual installations.
Every market’s demand will have different price points at which demand reduces as prices rise. In the off-grid mining industry, where solar is competing with diesel or LNG for electricity supply, the economic decision is unlikely to be affected by such price increases. In the on-grid utility market, projects are very price-sensitive, particularly for projects that have won competitive auctions based on module prices six to 12 months ago. The rooftop PV space will be dependent on local tariffs and incentives. While there is significant uncertainty on inflationary pressures from commodities, the results highlight the possibility of a negative growth year for PV in 2022.
Modules and their associated shipping costs typically comprise between a quarter and a third of total project capex and together represent the single-largest item of a project’s cost. When the cost of modules – and shipping – increases, it can therefore have a significant impact on project economics.
Rystad Energy performed a sensitivity analysis to determine the LCOE for different plant sizes, comparing last year’s module and shipping costs with the current costs. The results show that the LCOE of new projects will have increased by between 10% and 15%. Such price rises could have a multitude of effects: they could lead to a reduction in demand as projects are cancelled or delayed; the increased cost could be passed onto the offtaker in the form of higher power purchase agreement prices; or developers could accept higher costs.
The current bottlenecks are not expected to be relieved within the next 12 months, meaning developers and offtakers will have to decide whether to reduce their margins, delay projects or increase offtake prices to get projects to financial close. Rystad Energy forecasts that 50GW of utility PV that is due to start construction in the first half of next year is at risk of delay or cancellation due to cost inflation. Alternatively, higher power purchase agreements (PPAs) will need to be negotiated or developers will have to accept higher project costs, which will lower margins.
Capacity increase needed
In the longer term, the solar industry must increase capacity and continue to fight cost escalation to meet climate change goals. Rystad Energy estimates that to maintain the global temperature increase below 1.5°C, we should have module production capacity of 1,200–1,400GW by 2035 to be handle the peak installations needed.
For solar panel manufactures to achieve this milestone, the aggregated production capacity should ideally grow annually at a rate of 10%. In the past, module capacity has grown at a similar rate, however, with the current supply shortages in essential raw materials like polysilicon, silver and glass, and the price hike in auxiliary raw materials, it would be a very ambitious and unrealistic target for solar companies to achieve. In fact, by 2035, the solar PV industry would have to source seven times more silver than it does today, when it already consumes 10% of global silver production.
Nevertheless, if we consider limiting global warming to 1.7°C, we could be able to achieve this scenario even with current supply constraints. As we have enough capacity for another eight years, this should give solar companies more time to expand production capacity. To accomplish the 1.7°C scenario, companies should be able to expand production capacity to 1,000GW–1,200GW by 2045, while still consuming a large part of silver and polycrystalline, but allowing supply to adapt.
To see the digital version of this report, please click here
To purchase printed copies or a PDF of this report, please email gloria.balbastro@lseg.com